Data plays a key role in broadening participation in computing. Building on the power of big national data sets like IPEDS, the CIC works with schools to analyze detailed trends in enrollment and retention in their undergraduate computing programs via our own Data Program, and through DAPPIC.
CIC Data Program
Data Collection
The CIC purposefully designed a data program that was additive to the field. Specifically, we seek to support schools in the collection and analysis of student outcome so that computing departments have a deeper understanding of how undergraduate computing students are faring in introductory courses and in the major as a whole. Data is collected course-by-course and term-by-term and then visualized in a series of easy to use dashboards. This approach allows users to “zoom-in,” pinpoint challenges, and track the impact of specific interventions.
Any school interested in learning more about and/or joining the CIC’s Data Program, please email khoury-cic@northeastern.edu.
Data Visualization
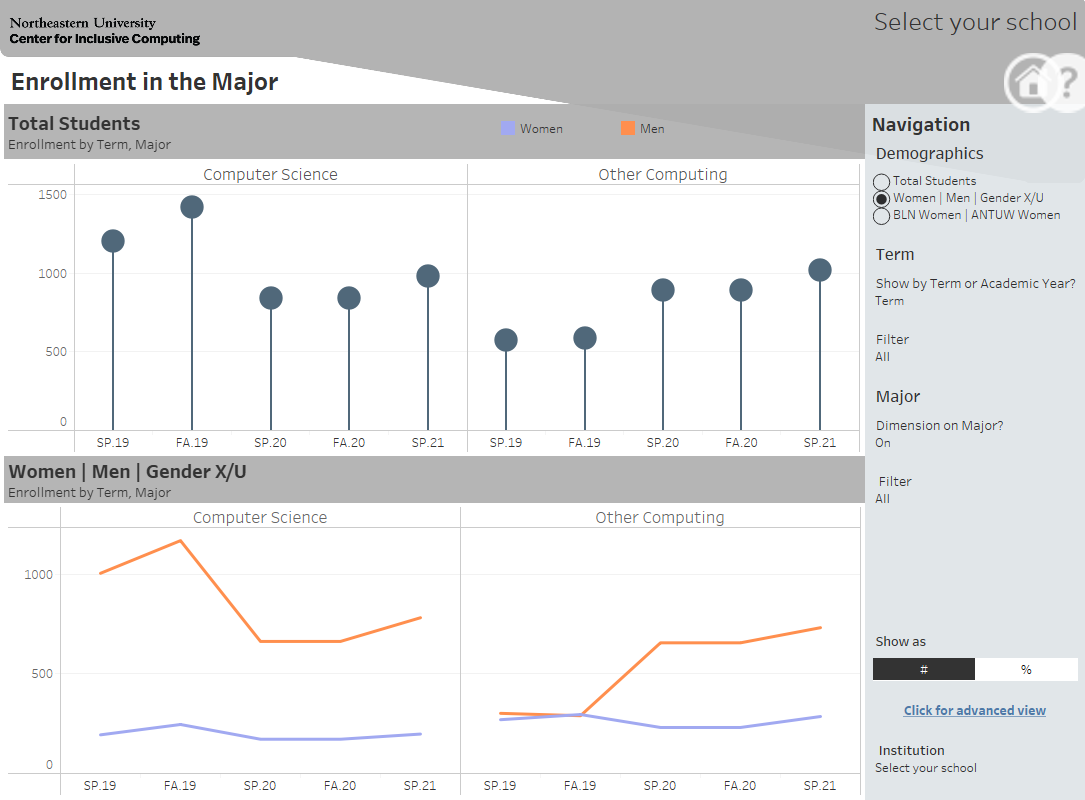
Data is visualized in interactive dashboards so users can better understand the experience of different undergraduate student populations.
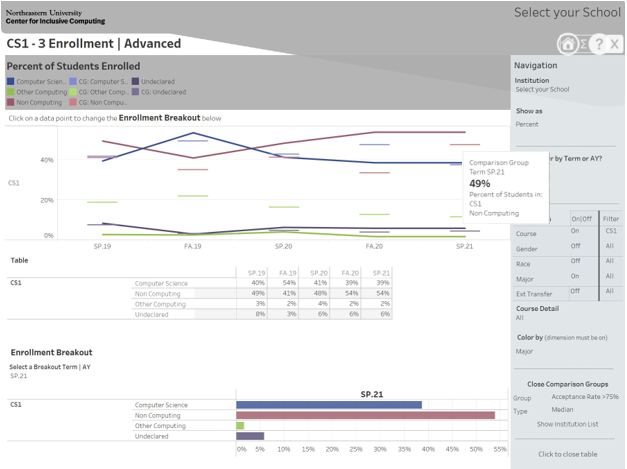
Partner Schools have the choice of “at-a-glance” or “in-depth” dashboard views and can tailor their visualizations through an array of dimensions such as major, course, external transfer, etc.
Comparison Groups
Within the CIC Data Visualization Dashboards, universities can compare their data to that of peer institutions within the CIC portfolio, aggregated within comparison groups. These comparison groups are based on publicly available institutional data or characteristics, such as overall size of computing department, university access levels, university research levels, and more.
CIC Data Program FAQ
Schools looking to participate at the undergraduate level submit the following historic and current data:
- Student enrollment, completion, and levels of faculty/TA support in introductory CS courses
- Term-to-term retention and graduation of computing majors
Click here to see a high level overview of data collected in the CIC Data Program.
The CIC works with over 40 schools that are building a bridge to one or more of their MS in computing degrees. We aggregate data from these schools (number of students, undergraduate major, demographics, student outcomes) so we can learn from one another and also so we can tell a national impact story about the BPC effectiveness of this approach.
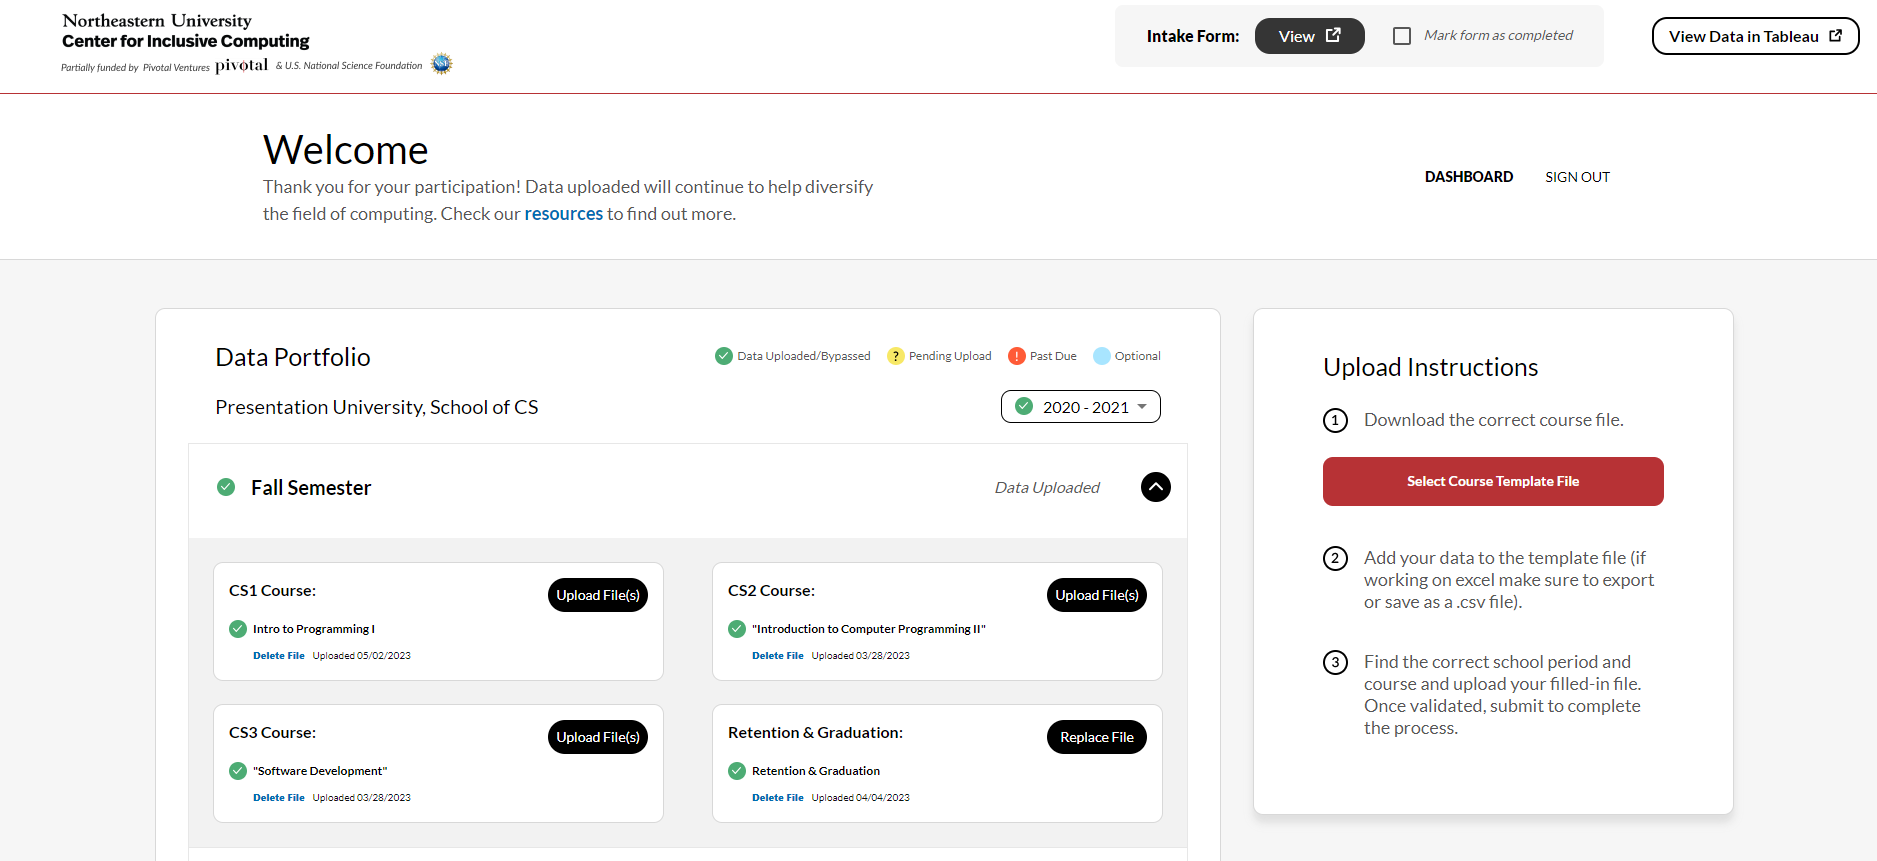
Data is submitted to the CIC Data Collection Portal via file upload twice a year (fall and spring). When a school first joins the data program, they will also submit two years’ (four terms) worth of historic data. To submit, the user downloads four file templates (these files are called “CS1”, “CS2”, “CS3”, and “Retention & Graduation”) and then uploads these files in .csv format once they are populated. If a school has more than one introductory course pathway, they are welcome to submit multiple CS1, CS2, and CS3 files.

The CIC provides a step by step guide to support data entry and define key terms (the CIC Data Collection Handbook). In addition, Partner Schools can ask questions of the CIC team at any time.
Great question! Thank you for asking.
Validation rules are transparent to the user up front. When you upload a file, you will get immediate feedback on any failed validation so you can correct and successfully submit.
All data points are validated within a single question (e.g. the sum of the parts must equal the total provided) and certain data points are validated across multiple questions (e.g. the sum of enrollment in each major must equal the total enrollment).
The CIC does not, however, provide validation across reporting periods.
Staffing this work is almost always a combination of members of the computing department and the institutional research team. In certain cases, schools have found it useful and/or necessary to involve HR and/or the registrar. It’s a great idea to have a primary point person to oversee things like setting up the data queries and dealing with anomalies.
The first data submission is by far the most time consuming as it entails meeting with the CIC to understand the data points, working with internal partners, designing and testing queries, and importing data into file template for the 4 historic periods. This set up can take up to 40 hours. Subsequent data submissions average around 8 hours.
We welcome any institution that would like to participate in the CIC Data Program. If you are interested in learning more about and/or joining, email us at khoury-cic@northeastern.edu.
DAPPIC
The CIC and the Center for Evaluating the Research Pipeline (CERP, Computing Research Association) formed the BPC-Alliance DAPPIC: Data Alliance on Persistence and Perception in Computing. DAPPIC’s goal is to integrate department level data collected by CIC and student level data collected by CERP to provide a multi-level look at data on BPC.
Learn moreOur Funders
Our Data Program is funded in part by Pivotal Ventures and the National Science Foundation.
 |
|
Our Partners
Action Analytics
An independent consultancy of industry-leading data and visualization experts.
Thank you to Shaun Davis at Action Analytics for not only designing and building the Data Viz Dashboards, but your brilliant thought partnership, patient teaching, and continued commitment to our mission.
Yeti
An IoT application development company
Thank you to the whole Yeti team for building a beautiful, user-friendly Data Collection Portal and making collecting data fun!